 siggraph
siggraph
siggraph

Papers Session 5: Volume Visualization
 Full Conference Pass
 Full Conference 1-Day Pass
 Basic Conference Pass
Date/Time: 30 November 2017, 04:15pm - 06:00pm
Venue: Silk 4
Location: Bangkok Int'l Trade & Exhibition Centre (BITEC)
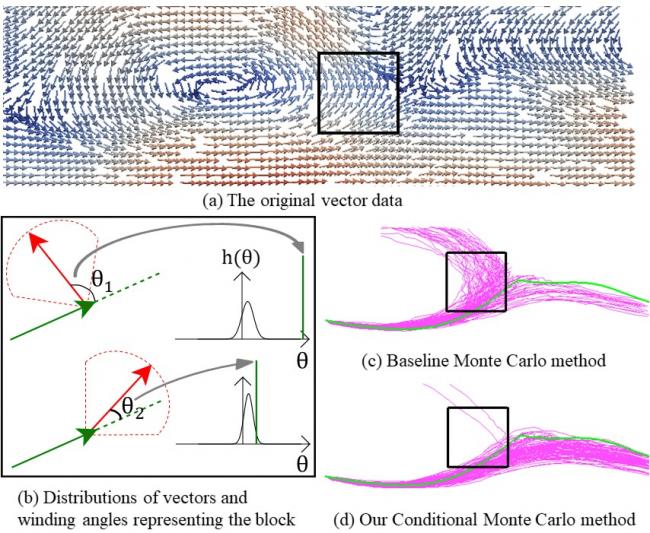
Winding Angle Assisted Particle Tracing in Distribution-Based Vector Field
Summary: Distribution models are widely used for data reduction applications. The Gaussian mixture model (GMM) is a powerful tool to capture multiple-peak distributions. For distribution-based vector field datasets represented by GMM, there are still loss of information which sometimes causes too much error when performing flow line tracing tasks. As a compensation, we analyze the vector transition pattern between consecutive vector directions. The vector transition is depicted by distributions of winding angles. When performing streamline and pathline tracing, we utilize the winding angle to estimate a conditional distribution of local vectors, using the Bayes Theorem. The conditional distribution can be used for both Monte Carlo flow line tracing, and single flow line tracing. We applied our distribution model on data reduction applications, and demonstrated that improved flow line tracing quality was achieved.
Author(s): Cheng Li, The Ohio State University
Han-Wei Shen, The Ohio State University
Pointwise Information Guided Visual Analysis of Time-varying Multi-fields
Summary: Identification of salient features from a time-varying multivariate system plays an important role in scientific data understanding. In this work, we present a unified analysis framework based on mutual information and two of its decomposition: specific and pointwise mutual information to quantify the amount of information content between different value combinations from multiple variables over time. The pointwise mutual information (PMI), computed for each value combination, is used to construct informative scalar fields, which allow close examination of combined and complementary information possessed by multiple variables. Since PMI gives us a way of quantifying information shared among all combinations of scalar values for multiple variables, it is used to identify salient isovalue tuples. Visualization of isosurfaces on those selected tuples depicts combined or complementary relationships in the data. For intuitive interaction with the data, an interactive interface is designed based on the proposed information-theoretic measures. Finally, successful application of the proposed method on two time-varying data sets demonstrates the efficacy of the system.
Author(s): Soumya Dutta, The Ohio State University
Xiaoting Liu, IBM Almaden Research Center
Ayan Biswas, Los Alamos National Laboratory
Han-Wei Shen, The Ohio State University
Jen-Ping Chen, The Ohio State University

ISAVS: Interactive Scalable Analysis and Visualization System
Summary: Modern science is inundated with ever increasing data sizes as computational capabilities and image acquisition techniques continue to improve. For example, simulations are tackling ever larger domains with higher fidelity, and high-throughput microscopy techniques generate larger data that are fundamental to gather biologically and medically relevant insights. As the image sizes exceed memory, and even sometimes local disk space, each step in a scientific workflow is impacted. Current software solutions enable data exploration with limited interactivity for visualization and analytic tasks. Furthermore analysis on HPC systems often require complex hand-written parallel implementations of algorithms that suffer from poor portability and maintainability. We present a software infrastructure that simplifies end-to-end visualization and analysis of massive data. First, a hierarchical streaming data access layer enables interactive exploration of remote data, with fast data fetching to test analytics on subsets of the data. Second, a library simplifies the process of developing new analytics algorithms, allowing users to rapidly prototype new approaches and deploy them in an HPC setting. Third, a scalable runtime system automates mapping analysis algorithms to whatever computational hardware is available, reducing the complexity of developing scaling algorithms. We demonstrate the usability and performance of our system using a use case from neuroscience: filtering, registration, and visualization of tera-scale microscopy data. We evaluate the performance of our system using a leadership-class supercomputer, Shaheen II.
Author(s): Steve Petruzza, University of Rome , SCI Institute, University of Utah
Aniketh Venkat, SCI Institute, University of Utah
Attila Gyulassy, SCI Institute, University of Utah
Giorgio Scorzelli, SCI Institute, University of Utah
Frederick Federer, University of Utah
Alessandra Angelucci, University of Utah
Valerio Pascucci, SCI Institute, University of Utah
Peer-Timo Bremer, Lawrence Livermore National Laboratory

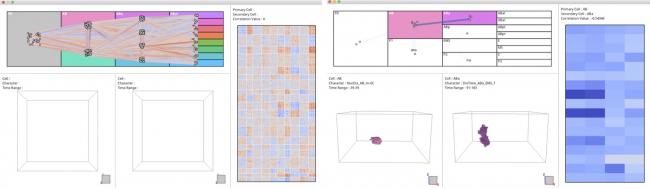
Development of a Visual Analytics System for Cell division Dynamics in Early C.elegans Embryos
Summary: In order to elucidate the developmental mechanisms of multicellular organisms, it is important to quantify the spatiotemporal features (phenotypic characteristics) of cells appearing during cell division and to analyze their relationships (correlations). Many analytical techniques have been proposed, including graph visualization technology. However, in addition to specifying interesting characteristics from large data, obtaining biological interpretations is difficult and time-consuming. To solve such problems, we developed a visual analysis system that enables exploratory analysis by linking the phenotypic characteristics of nematodes to the spatiotemporal shape of the cell nucleus. Through our experiments, we performed user evaluations for experts who research the developmental dynamics of the cells. This system enabled the users to analyze these dynamics thoroughly and develop novel concepts.
Author(s): Sayaka Nagai, Kobe University