 siggraph
siggraph
siggraph

Papers Session 4: Graph Drawing
 Full Conference Pass
 Full Conference 1-Day Pass
 Basic Conference Pass
Date/Time: 30 November 2017, 02:15pm - 04:00pm
Venue: Silk 4
Location: Bangkok Int'l Trade & Exhibition Centre (BITEC)
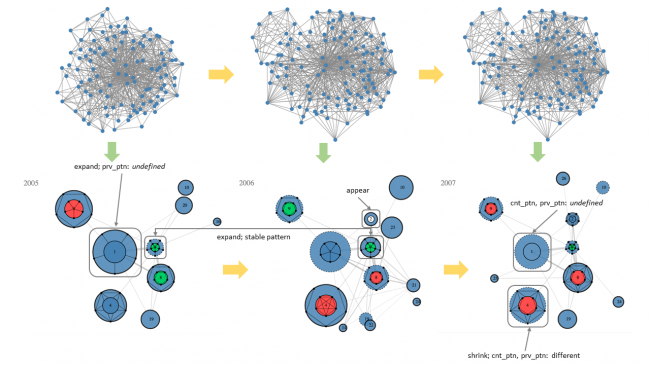
Smooth Animation of Structure Evolution in Time-Varying Graphs with Pattern Matching
Summary: Drawing a large graph into the limited display space often raises visual clutter and overlapping problems. The complex structure hinders the exploration of significant patterns of connections. For time-varying graphs, it is difficult to reveal the evolution of structures. We group nodes and links into partitions, where objects within a partition are more closely related. Besides, partitions maintain stable across time steps. We focus on the structural changes of partitions. The complex structure of a partition is simplified by mapping to a pattern. The structural changes are exposed by comparing patterns of two consecutive time steps. We created various visual designs to present different scenarios of changes. In order to achieve a smooth animation of time-varying graphs, we extract the graph layout at each time step from a super-layout which is based on the super-graph and super-community. The effectiveness of our approach is verified with two datasets, one is a synthetic dataset, and the other is the DBLP dataset.
Author(s): Yunzhe WANG, The Hong Kong Polytechnic University
Optimal Tree Reordering for Group-In-a-Box Graph Layouts
Summary: Visualizing the group structure of graphs is important in analyzing complex networks. The group structure referred to here includes not only community structures defined in terms of modularity and the like but also group divisions based on node attributes. Group-In-a-Box (GIB) is a graph-drawing method designed for visualizing the group structure of graphs. Using a GIB layout, it is possible to simultaneously visualize group sizes and both within-group and between-group structures. However, conventional GIB layouts do not visualize between-group relations, causing many long edges to appear in the graph area and potentially reducing graph readability. This paper focuses on the tree structure of treemap used in GIB layouts as a basis for proposing a tree-reordered GIB (TRGIB) layout with a procedure for replacing sibling nodes in the tree structure. Group proximity is defined in terms of between-group distances and connection weights, and an optimal tree reordering problem (OTRP) that minimizes group proximity is formulated as a mixed-integer linear programming (MILP) problem. Through computational experiments, we show that optimal layout generation is possible in practical time by solving the OTRP using a general mathematical programming solver.
Author(s): Yosuke Onoue, Kyoto University
Koji Koyamada, Kyoto University

Mobile Situated Analytics of Ego-Centric Network Data
Summary: Situated Analytics has become popular and important with the resurge of Augmented Reality techniques and the prevalence of mobile platforms. However, existing Situated Analytics could only assist in simple visual analytical tasks such as data retrieval, and most visualization systems capable of aiding complex Visual Analytics are only designed for desktops. Thus, there remain lots of open questions about how to adapt desktop visualization systems to mobile platforms. In this paper, we conduct a study to discuss challenges and trade-offs during the process of adapting an existing desktop system to a mobile platform. With a specific example of interest, egoSlider \cite{slider}, a four-view dynamic ego-centric network visualization system is tailored to adapt the iPhone platform. We study how different view management techniques and interactions influence the effectiveness of presenting multi-scale visualizations including Scatterplot and Storyline visualizations. Simultaneously, a novel Main view+Thumbnails interface layout is devised to support smooth linking between multiple views on mobile platforms. We assess the effectiveness of our system through expert interviews with four experts in data visualization.
Author(s): Mingqian Zhao, Hong Kong University of Science and Technology
Yijia Su, Hong Kong University of Science and Technology
Jian Zhao, FX Palo Alto Laboratory, Palo Alto, CA, USA
Shaoyu Chen, Hong Kong University of Science and Technology
Huamin Qu, Hong Kong University of Science and Technology

Interactive Design and Visualization of N-ary Relationships
Summary: This paper provides a set of visualization principles for visualizing N-ary relationships as well as a set of algorithms.
Author(s): Botong Qu, Oregon State University
Prashant Kumar, Oregon State University
Eugene Zhang, Oregon State University
Pankaj Jaiswal, Oregon State University
Laurel Cooper, Oregon State University
Justin Elser, Oregon State University
Yue Zhang, Oregon State University