 siggraph
siggraph
siggraph

Papers Session 2: Visual Reasoning
 Full Conference Pass
 Full Conference 1-Day Pass
 Basic Conference Pass
Date/Time: 29 November 2017, 04:15pm - 06:00pm
Venue: Silk 4
Location: Bangkok Int'l Trade & Exhibition Centre (BITEC)
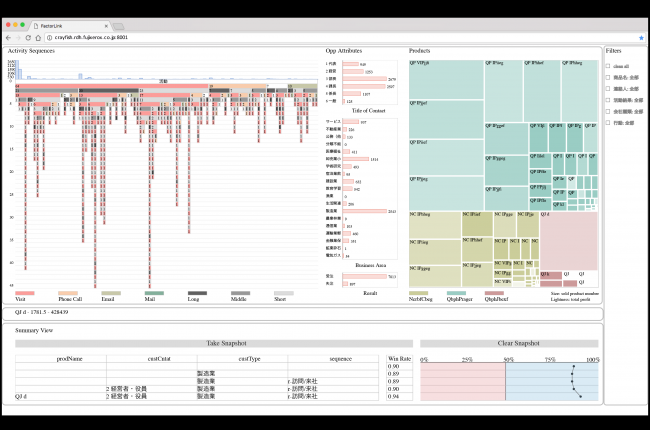
FactorLink: A Visual Analysis Tool for Sales Performance Management
Summary: Sales Performance Management (SPM) solutions for enterprise-grade businesses generate large volumes of multi-dimensional data, including temporal event sequences and tabular attributes. Among attributes of different data structures, it is difficult to find clear connections between factors and outcomes. Discovering key factors and their influences from multivariate data can provide instructional advice to help sales representatives maintain healthy relationships with customers and achieve sales goals. This presentation introduces the FactorLink approach for 1) correlating temporal event sequences, multi-dimensional tabular data with their outcomes, 2) interactively assisting users to find key factors and understand their influences, and 3) exploring potential outcomes by reviewing and comparing the patterns found in the integrated SPM data. Through several case studies, this presentation demonstrates the effectiveness of our approach.
Author(s): Chuan Wang, Fuji Xerox Co. Ltd, University of California Davis
Takeshi Onishi, Fuji Xerox Co., Ltd
Kwan-Liu Ma, University of California Davis
Visual Analytics of Brain Effective Connectivity using Convergent Cross Mapping
Summary: To elucidate the dynamics of information processing in the brain, it is necessary to identify the direction of neural information transmission in the neuronal network and clarify the effects (i.e., the causal relationship) of neuronal activity in one area on neuronal activity in another area. Convergent cross mapping (CCM) has been employed in the neuroscience field to examine the effective connectivity of brain functions. CCM can detect causality from time series data created from deterministic and nonlinear systems. Because CCM includes complicated processes such as the determination of advance parameters, the confirmation of nonlinearity, and the interpretation of results, which results in a lowering of the usability of CCM, there is a strong need for an effective visual interface. In this paper, we propose a visual analytic system that increases the usability of CCM and contributes to new discoveries in effective connectivity. The usability was evaluated using a domain expert questionnaire. It was confirmed that the usability was improved by comparing the proposed system to the original character user interface from the viewpoint of the results and process comprehensibility. In addition, with the proposed system, new findings in human brain connectivity have been obtained from actual magnetoencephalography data during visual cognitive task and resting-state task.
Author(s): Hiroaki Natsukawa, Kyoto University
Koji Koyamada, Kyoto University

A Multi-layered Visualization Language for Video Augmentation
Summary: There are many tasks that humans perform that involve observing video streams, as well as tracking objects or quantities related to the events depicted in the video, that can be made more transparent by the addition of appropriate drawings to a video, e.g., tracking the behavior of autonomous robots or following the motion of players across a soccer field. We describe a specification of a general means of describing groups of time-varying discrete visualizations, as well as a demonstration of overlaying those visualizations onto videos in an augmented reality manner so as to situate them in a real-world context, when such a context is available and meaningful. Creating such videos can be especially useful in the case of autonomous agents operating in the real world; we demonstrate our visualization procedures on two example robotic domains. We take the complex algorithms controlling the robots' actions in the real world and create videos that are much more informative than the original plain videos.
Author(s): Danny Zhu, Carnegie Mellon University
Manuela Veloso, Carnegie Mellon University

A Visual Causal Exploration Framework / Case Study: A Torrential Rain and a Flash Flood in Kobe City
Summary: Extreme weather events, such as unexpected and sudden torrential rains, have received increasing attention by the specialists as well as ordinary people due to the possibility of causing severe material damages and human losses. Computational climate scientists have been working on high-resolution time-varying, multivariate numerical simulations of this kind of short-term event, which is still hard to predict. Local governments of the natural disaster prone countries, like Japan, usually possess disaster management sectors, responsible for storing the disaster related data and analysis results. In this paper, we present a visualization framework for enabling the interactive exploration of the causality, such as of the disasters and the related extreme weather events. The end users will be able to identify the spatio-temporal regions where there is a strong strength of cause-effect relationships. As a case study, we studied the unexpected torrential rain occurred in the city of Kobe, in 2008, where a flash flood, in the urban area, caused some human losses. We utilized high-resolution computational climate simulation results executed on a supercomputer, and the measured river level data obtained from the Civil Engineering Office of Kobe City. We expected that this kind of tool can assist the specialists for better understanding the cause-effect relationships between the extreme weather and the related disasters, as well as, the local government policy makers in the adaptation policies for the disaster risk reductions.
Author(s): Jorji Nonaka, RIKEN AICS
Naohisa Sakamoto, Kobe University
Koji Koyamada, Kyoto University
Kenji Ono, Kyushu University