 siggraph
siggraph
siggraph

Papers Session 1: Visual Data Mining
 Full Conference Pass
 Full Conference 1-Day Pass
 Basic Conference Pass
Date/Time: 29 November 2017, 02:15pm - 04:00pm
Venue: Silk 4
Location: Bangkok Int'l Trade & Exhibition Centre (BITEC)
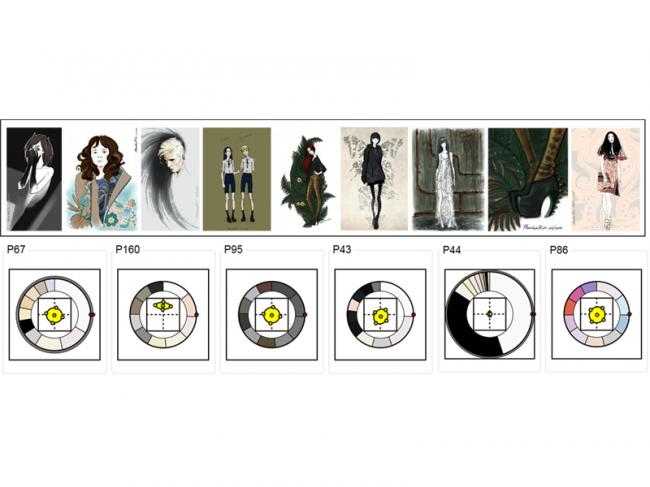
Mining Probabilistic Color Palettes for Summarizing Color Use in Artwork Collections
Summary: Artists and designers often use examples to find inspirational ideas for using colors. While growing public art repositories give artists and designers more examples to choose from, understanding the color use in such large artwork collections can be challenging. In this paper, we present a novel technique for summarizing the color use in a large collection of artworks. Our technique is based on a novel representation, probabilistic color palettes, which can intuitively summarize the contextual and stylistic use of colors in a collection of artworks. Unlike traditional color palettes that only encapsulate what colors are used using a compact set of representative colors, probabilistic color palettes encode the knowledge of how the colors are used in terms of frequencies, positions, and sizes, using an intuitive set of probability distributions. Given a collection of artworks organized by artist, we learn the probabilistic color palettes using a probabilistic colorization model, which describes the colorization process in a probabilistic framework and considers the impact of both spatial and semantic factors upon the colorization process. The learned probabilistic color palettes allows users to quickly understand and explore the color use within the collection. We present results on a large collection of artworks by different artists, and evaluate the effectiveness of our probabilistic color palettes in a user study.
Author(s): Ying CAO, City University of Hong Kong
Antoni CHAN, City University of Hong Kong
Rynson LAU, City University of Hong Kong
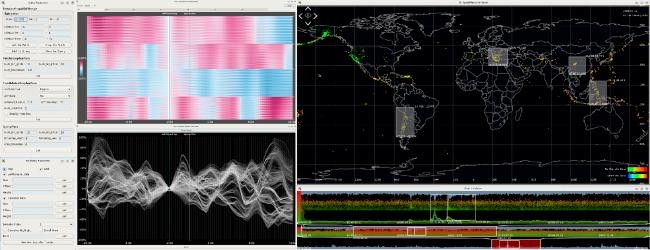
Visual Exploration of Ionosphere Disturbances for Earthquake Research
Summary: In seismic research, a hypothesis is that ionosphere disturbances are related to lithosphere activities such as earthquakes. Domain scientists are urgent to discover disturbance patterns of electromagnetic attributes in ionosphere around earthquakes, and to propose related hypotheses. However, the workflow of seismic researchers usually only supports pattern extraction from a few earthquakes. To explore the pattern-based hypotheses on a large spatiotemporal scale meets challenges, due to the limitation of their analysis tools. To tackle the problem, we develop a visual analytics system which not only supports pattern extraction of the original workflow in a way of dynamic query, but also extends the work with hypotheses exploration on a global scale. Domain scientists can easily utilize our system to explore the heterogeneous dataset, and to extract patterns and explore related hypotheses visually and interactively. We conduct several case studies to demonstrate the usage and effectiveness of our system in the research of relationships between ionosphere disturbances and earthquakes.
Author(s): Fan Hong, Peking University
Siming Chen, Peking University
Hanqi Guo, Argonne National Laboratory
Xiaoru Yuan, Peking University
Jian Huang, University of Tennessee, Knoxville
Yongxian Zhang, China Earthquake Networks Center
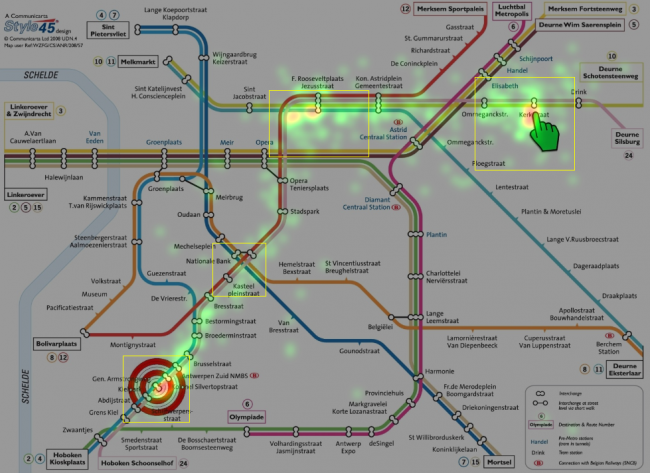
Mining and Visualizing Eye Movement Data
Summary: Eye movement data has a spatio-temporal nature which makes the design of suitable visualization techniques a chal- lenging task. Moreover, eye movement data is typically recorded by tracking the eyes of various study participants in order to achieve significant results about applied visual task solution strategies. If we have to deal with vast amounts of eye move- ment data, a data preprocessing in form of data mining is useful since it can be applied to compute a set of rules. Those aggregate and filter the original data by clever algorithms to reduce the amount of data and to derive patterns in it. The generated rule sets are still large enough to serve as input data for a visualization or visual analytics technique. In this paper we describe a visual analysis model for eye movement data combining data mining and visualization with the goal to get an impression about point-of-interest (POI) and area-of- interest (AOI) correlations in eye movement data on different levels of spatial and temporal granularities. Those correla- tions can support a data analyst to derive visual patterns that can be mapped to data patterns, i.e., visual scanning strategies with different probabilities of all or a group of eye tracked people. We show the usefulness of our data mining and visualization system by applying it to datasets recorded in a formerly conducted eye tracking experiment investigating the readability of metro maps.
Author(s): Michael Burch, VISUS, University of Stuttgart, University of Stuttgart
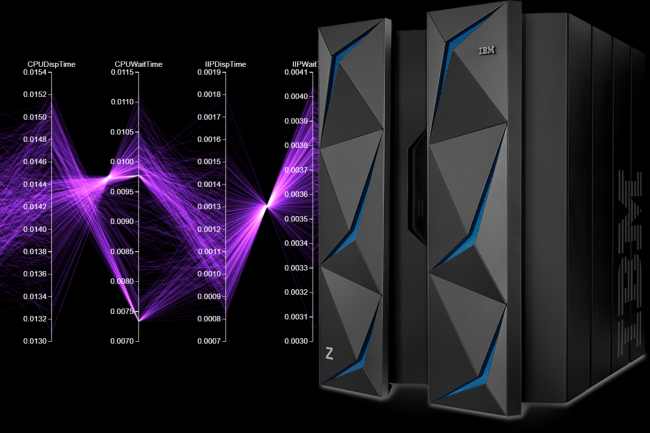
Visual Exploration of Mainframe Workloads
Summary: We present a visual analytics approach to support the workload management process for z/OS mainframes at IBM. This process typically requires the analysis of records consisting of 100 to 150 performance-related metrics, sampled over time. We aim at replacing the previous spreadsheet-based workflow with an easier, faster, and more scalable one regarding measurement periods and collected performance metrics. To achieve this goal, we collaborate with a developer embedded at IBM in a formative process. Based on that experience, we discuss the application background and formulate requirements to support decision making based on performance data for large-scale systems. Our visual approach helps analysts find outliers, patterns, and relations between performance metrics by data exploration through various visualizations. We demonstrate the usefulness and applicability of line plots, scatter plots, scatter plot matrices, parallel coordinates, and correlation matrices for workload management. Finally, we evaluate our approach in a qualitative user study with IBM domain experts.
Author(s): Christoph Schulz, University of Stuttgart
Nils Rodrigues, University of Stuttgart
Krishna Damarla, University of Stuttgart
Andreas Henicke, IBM
Daniel Weiskopf, University of Stuttgart